Why Our IQ Test?
Our original IQ test is the most scientifically valid free IQ test available online today.
Previously offered only to corporations, schools, and in certified professional applications, the test is now available to you. In addition to offering your free general IQ, we offer an optional extensive analysis of your score, reporting your performance in 13 different areas of intelligence and revealing your key cognitive strengths and weaknesses.
Developed by PhDs and statistically sound, our free test reflects the best research available and can be taken on any desktop, laptop, tablet, or phone.
And, it’s fun!

What Is an IQ?
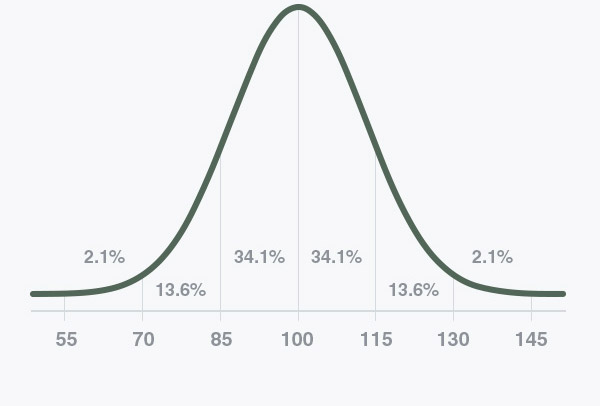
An Intelligence Quotient indicates a person’s mental abilities relative to others. Everyone has numerous specific mental abilities, some of which can be measured accurately and are reliable predictors of academic and financial success.
Read more about Intelligence Testing
19,000,000
tests taken so far
--Sue M., Boulder, CO
--Peter Manning, NYC
--P. Conner

When you take the IQ Test, you will receive a General Score for free. That score gives you the big…
Among the first to investigate individual differences in mental ability was a British scientist, Sir Francis Galton, who compared people…
Originally, intelligence testing was used to detect children of lower intelligence in order to place them in special education programs.…